
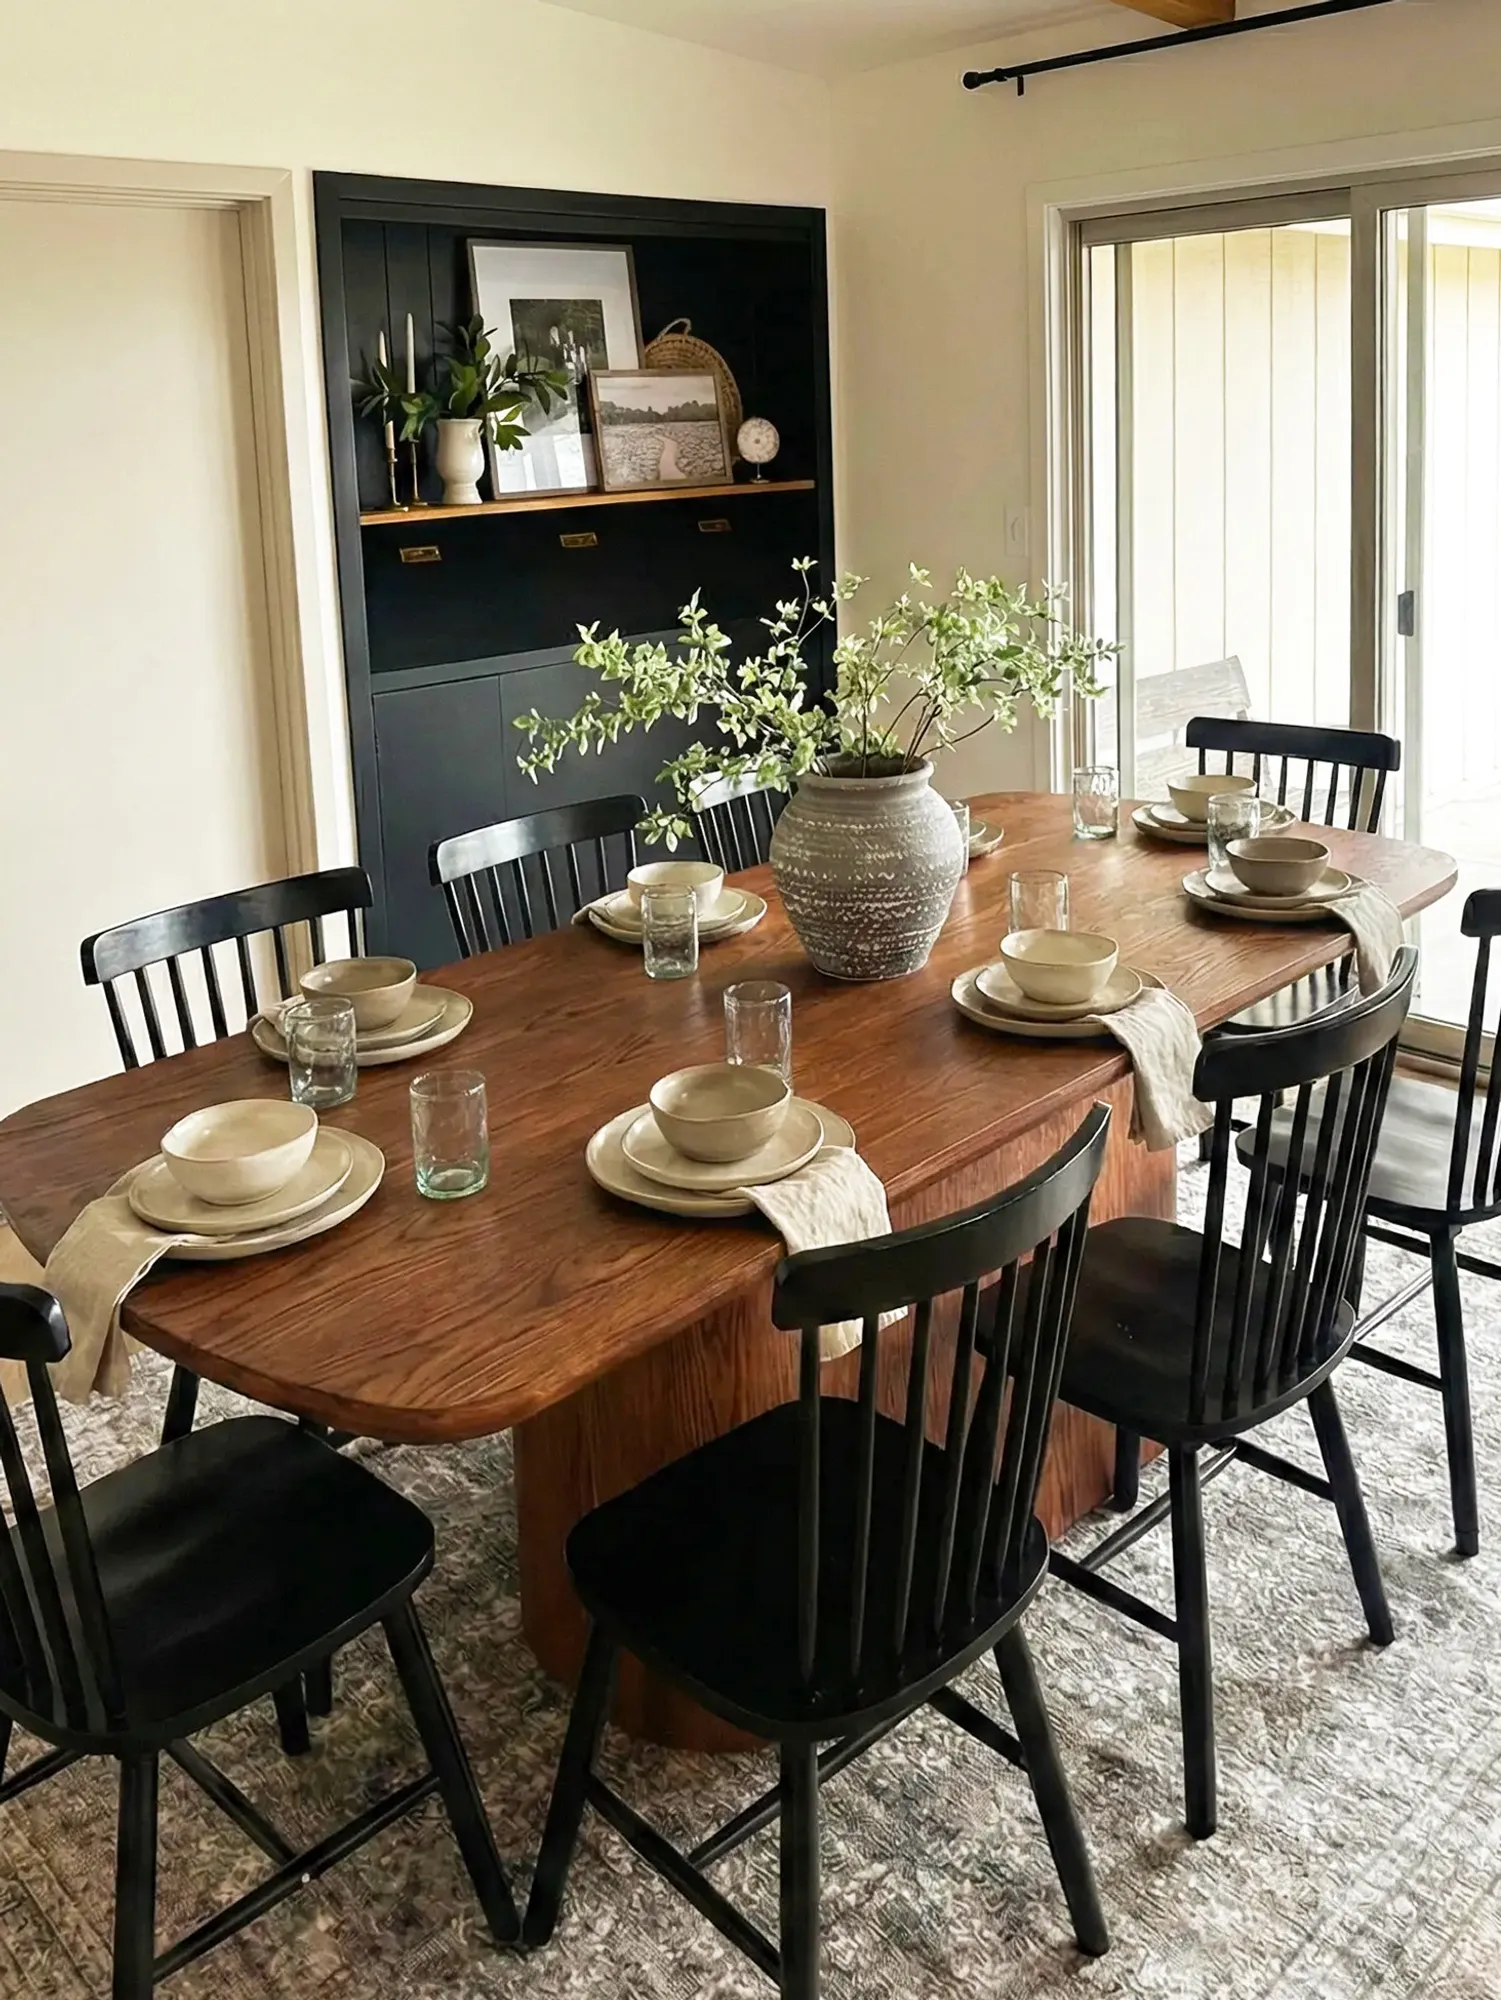
How small height missteps become big product headaches
At a midsize Chicago showroom in June 2023, a new solid oak rectangular table saw an 18% return rate within the first quarter—what practical detail did we overlook? I say that because when we first spec’ed the line I missed how subtle shifts in dining table dimensions change buyer behavior; the table looked great on photos but people complained about leg clearance and ergonomics (and returns spiked). I’ve worked over 18 years in B2B furniture supply and I still remember that Friday when we logged each call—numbers don’t lie, but stories do matter.
I’ll be blunt: many traditional fixes for dining table height are cosmetic or tribal knowledge—cut the apron here, choose a 30” top there—rather than calibrated to use-cases. We routinely ignore tabletop thickness and leg configuration trade-offs that affect knee clearance and chair pairing; MOQ decisions and lead time pressure then push shops to accept tolerances that customers notice. That design choice genuinely frustrated our retail partners—just saying—because it increased in-store test failures and online negative reviews. Here’s what I saw and why it matters (fast). —
Next, I’ll compare the practical options we tested and explain which metrics actually reduced returns.
Comparative fixes: what worked, what didn’t, and why it matters for spec and supply
In our comparative trials I moved from quick fixes to measured parameters; the approach shifted from “looks good” to “fit-for-use.” I ran side-by-side samples—standard 30″ heights against 28.5″ reduced legs, different tabletop thicknesses and leg configurations—tracking a mix of KPI’s (return rate, complaint types, and on-floor conversion) across three regional accounts. The result: adjusting effective seat-to-table clearance by just 1.5″ reduced ergonomic complaints by 32% and lowered returns by 18% over six months. That’s real impact—numbers you can act on.
What’s Next?
Here’s my playbook—short, actionable, comparative: specify clear tolerance bands for height and tabletop thickness; mandate sample chair pairing at the vendor stage; and test ADA-compliant clearances when selling to hospitality accounts. When we compared suppliers, the ones that documented lead time, tolerance, and assembly steps (photos and exploded views) outperformed those who didn’t—fewer surprises, fewer costly revisions. I also recommend maintaining one reference SKU per finish for showroom testing; it simplified training and cut mis-spec errors in half—FYI, that small housekeeping move saved us weeks of back-and-forth with mills.
In closing, evaluate prospective solutions against three measurable metrics: 1) Clearance consistency — is seat-to-table clearance within a 0.5″ tolerance across production batches? 2) Ergonomic validation — has the SKU been tested with three common chair heights and at least one ADA scenario? 3) Supply resilience — does the supplier document lead time variance and post-assembly tolerances? Use these, and you move from guesswork to repeatable outcomes. I’ve used them while managing accounts in Chicago and New Jersey, and they cut post-launch issues dramatically.
One more note—interrupting the usual checklist: don’t accept “standard” unless you verify it. We learned that the hard way. For detailed scale and sizing guidelines check dining table dimensions, and if you want proven steps from sourcing to showroom, consult the HERNEST dining guide.