
Intro — comparative logic up front
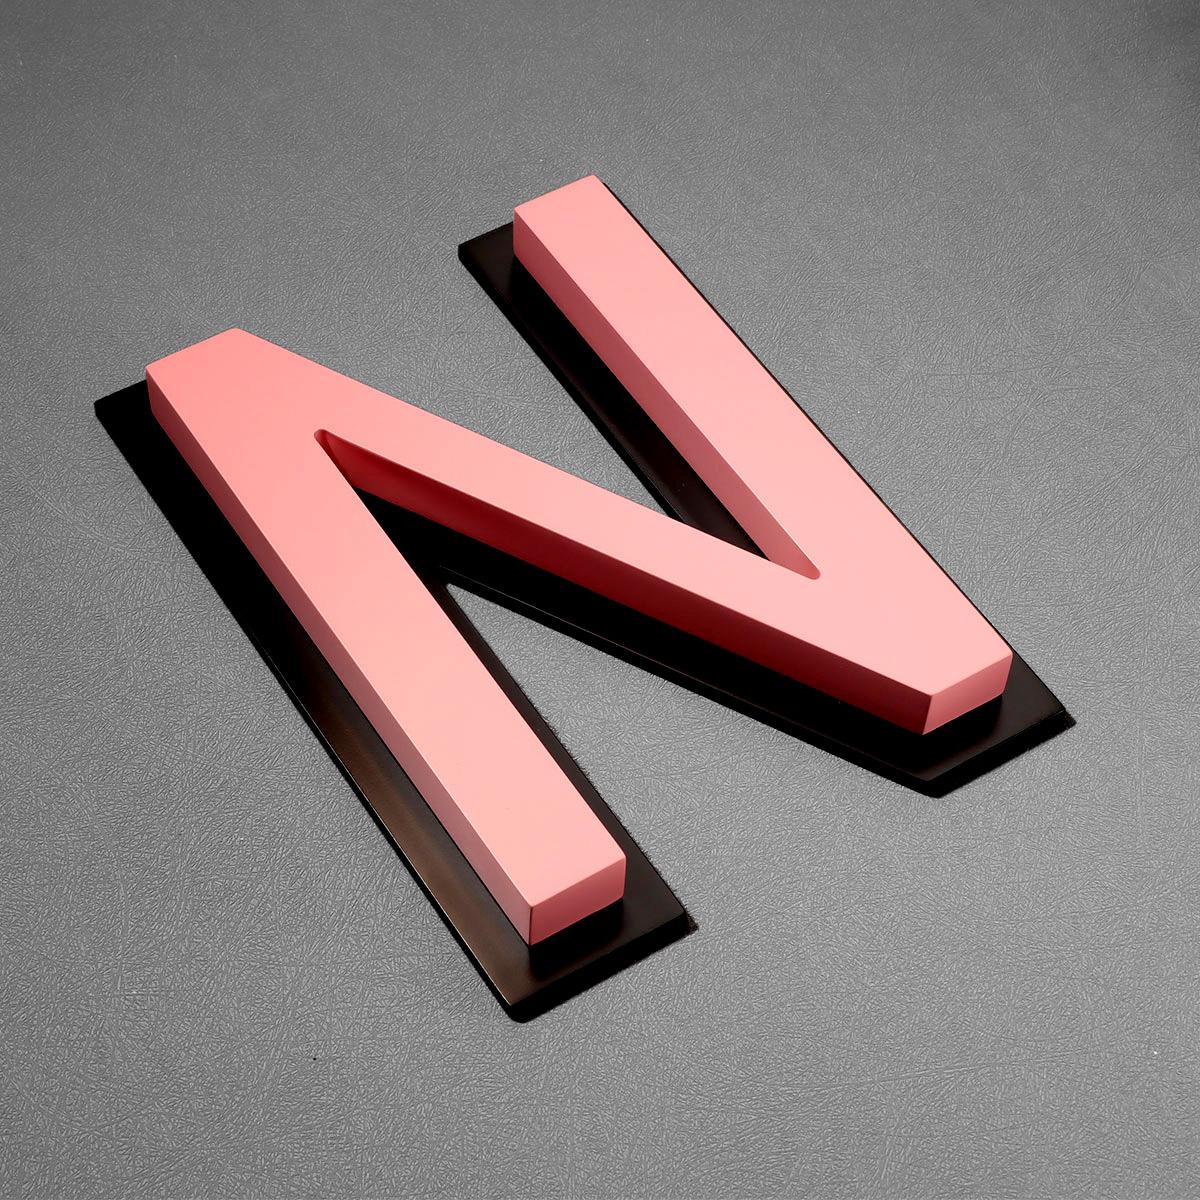
Corporate procurement teams often frame signage decisions as a CapEx problem. The truth is comparative: initial purchase price and customization scope compete with ongoing costs like energy, maintenance, and downtime. This piece isolates those vectors for illuminated solutions, with a focus on channel letters and practical ROI outcomes. The logic is simple: measure the one-time expense against predictable lifecycle outflows and pick the option with the best net present value for your site mix. Times Square and major retail corridors show how visibility scales value in real terms.
Cost Profiles: what sits in CapEx and what accrues as OpEx
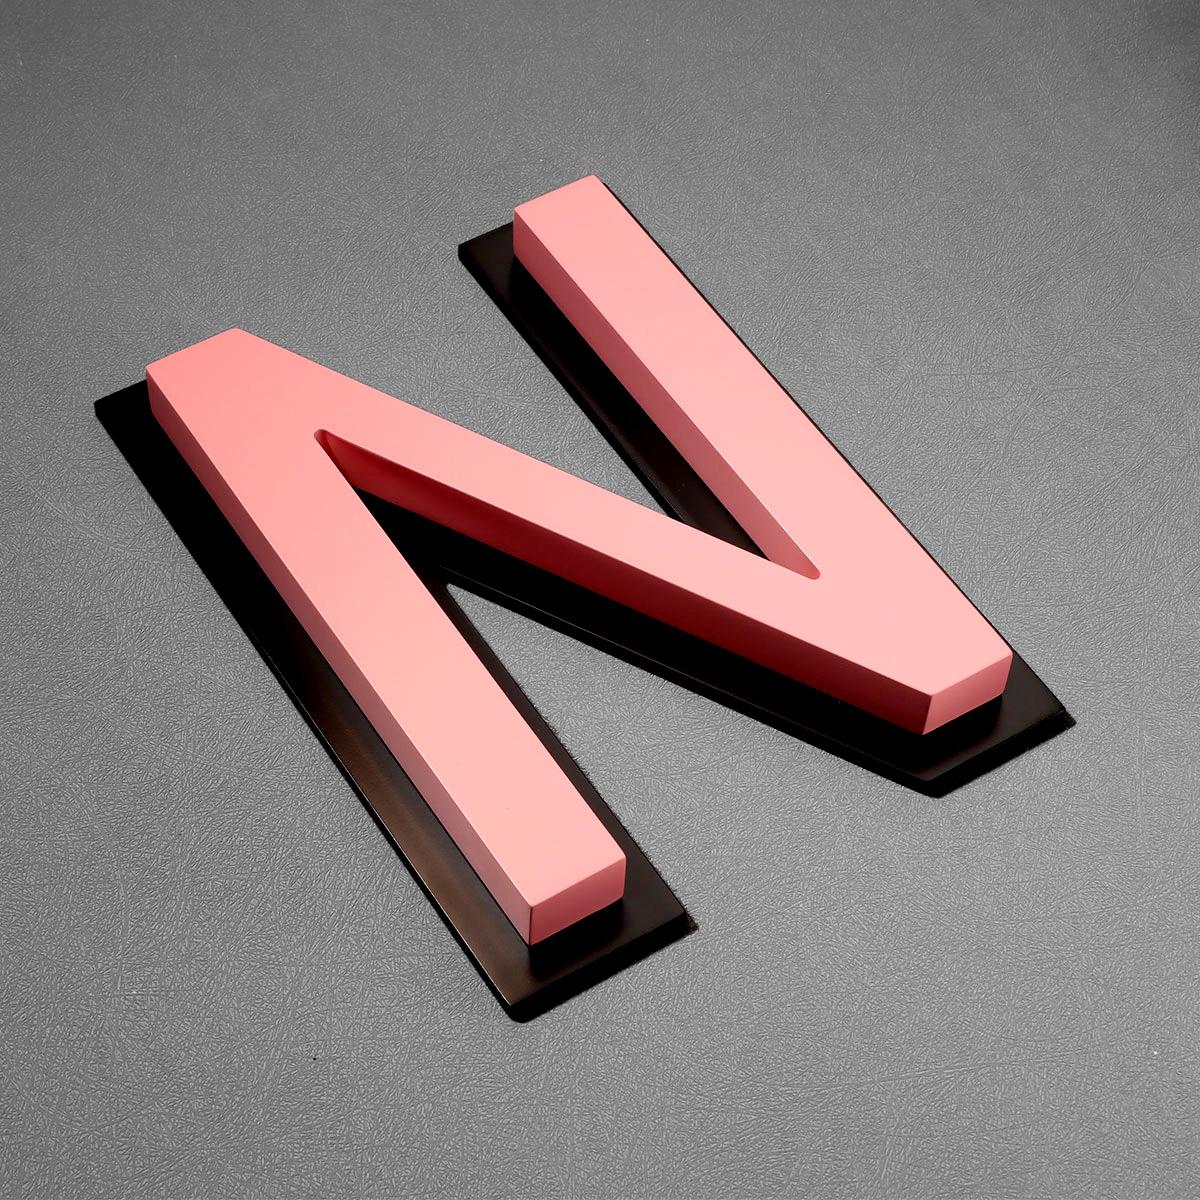
CapEx items are tangible: fabrication, custom face finishes, mounting hardware, and installation labor. Custom features—flush-mounted LED effects, stainless backers, or molded acrylic faces—raise CapEx but can reduce near-term maintenance if specified correctly. OpEx covers electricity for LED modules, scheduled cleaning, replacement of transformers, and signage repairs due to weather or vandalism. Document both sets as annualized figures; that makes comparison numeric, not opinion-based.
How customization strategy shifts ROI
Customization is not binary. Choose high-quality components where they reduce service frequency. For example: premium LED modules and sealed acrylic faces cost more initially but lower failure rates. Conversely, ornate metalwork increases CapEx and rarely reduces OpEx. Calculate payback by projecting expected lamp life, rated lumen depreciation, and replacement cycle. Use standard depreciation schedules and factor in installation complexity—longer install windows mean higher labor exposure and potential retail disruption.
Hidden operational cost drivers
Two elements often missed: access engineering and control electronics. Poor access design forces technicians into longer service windows; that multiplies labor cost and shutdown risk. Inadequate control systems create asynchronous brightness cycles, shortening LED life and driving warranty claims. Account for wiring runs, transformer placement, and gateway connectivity in the OpEx model. These are discrete, measurable items—not vague risks.
Comparative checklist for procurement
Use this checklist when evaluating suppliers and specs. Score each line item on a 1–5 scale and compute a weighted total by expected lifespan.
– Material quality (face, backer, enclosure)
– Luminaire efficiency (LED modules, driver efficiency)

– Ease of service (access panels, modular components)
– Warranty scope and on-site response SLAs
– Installation impact (scaffolding, permits, retail downtime)
Common mistakes — and sensible alternatives
Procurement often chases the lowest initial quote, then pays more in next-three-years service. Avoid this trap by requesting lifecycle cost sheets with replacement timelines. Don’t overload the façade with unnecessary customization that complicates mounting hardware or violates local code. If budget is constrained, opt for modular illuminated channel letters with field-replaceable LED modules rather than fully bespoke neon-style constructs—modularity reduces mean-time-to-repair and lowers spare-parts inventory.
Real-world anchor and a short note from the field
I audited a retail rollout in central Berlin where teams substituted higher-grade LED modules for cheaper units. The higher CapEx increased the project cost by 12% but cut three-year maintenance interventions by half—less ladders, less lost retail hours. The outcome was measurable: stability of brand illumination and lower service invoices. — Practical proof beats speculative promises.
Decision framework: put numbers to preference
Step 1: Define a target timeframe (3–7 years). Step 2: List CapEx and annual OpEx line items. Step 3: Discount future OpEx to present value at your corporate discount rate. Step 4: Compare total cost of ownership per site. This method flags when bespoke options actually save money over time and when they don’t. Include a sensitivity run for worst-case weather and worst-case warranty response times.
Advisory — three critical metrics for selection
1) Lifecycle Cost per Year: Total present-value cost divided by projected service years. This shows real annual burden.
2) Mean Time to Repair (MTTR): Lower MTTR reduces operational downtime and prevents revenue loss at busy locations.
3) Energy-to-Lumen Ratio: Efficient LED modules lower OpEx directly and reduce thermal stress on enclosures.
These are the golden rules for a procurement team deciding between cheap upfront fabrication and engineered customization. Final thought: when signage choices are aligned with maintenance realities, brand appearance and cost-efficiency both improve. Cosun Sign. —